powerbi-training-en
04 Drillthrough
Within Adventure Works, your manager is particularly pleased with the geographic possibilities of Power BI. However, it is not very useful to repeat all the geographic background information about a region in every report. Ideally, she would like to be able to “click through” to all information about that country in the case of an outlier in sales in a certain country, for example. For example, the trend in sales in recent years, the number of branches in that country, etc.
This “clicking through” is called drillthrough in a BI tool. In module 3 we already looked at the drilldown. The drillthrough basically means that you take a closer look at a number on another page or in another report. This way you can easily see the context - for example of the sales within a certain country. Below is an example as it will work at the end of the module (so you can see how a drillthrough works).
Notice that you will not yet see this result if you start this lab, this is a preview of what you will achieve at the end
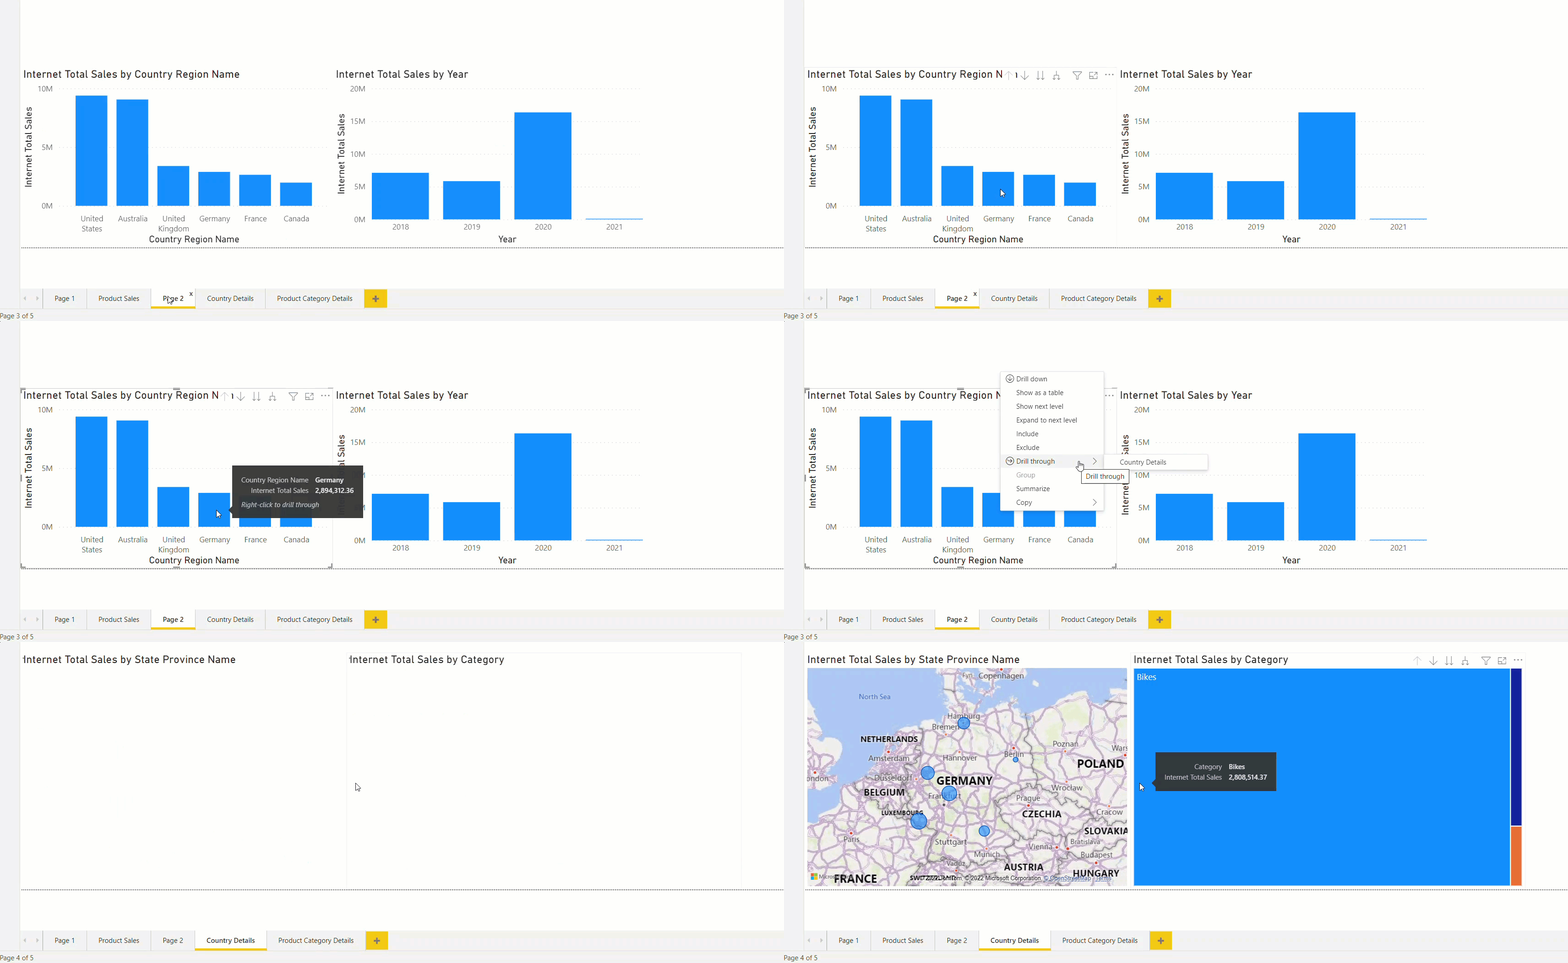
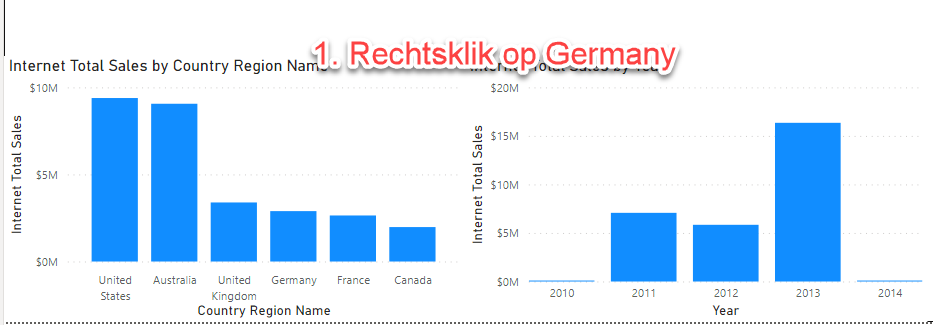
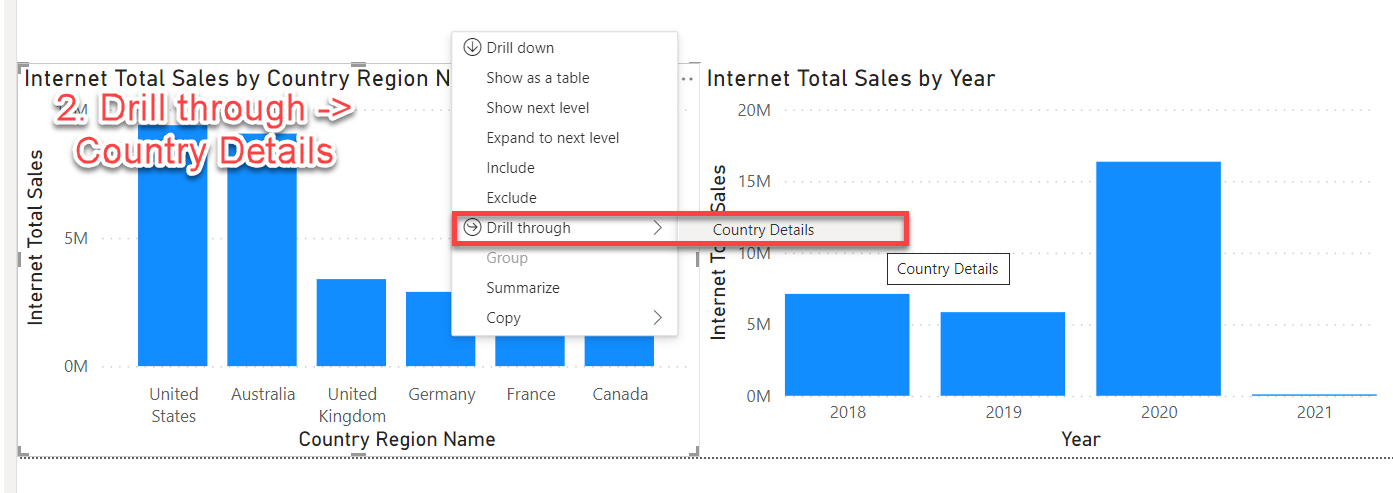
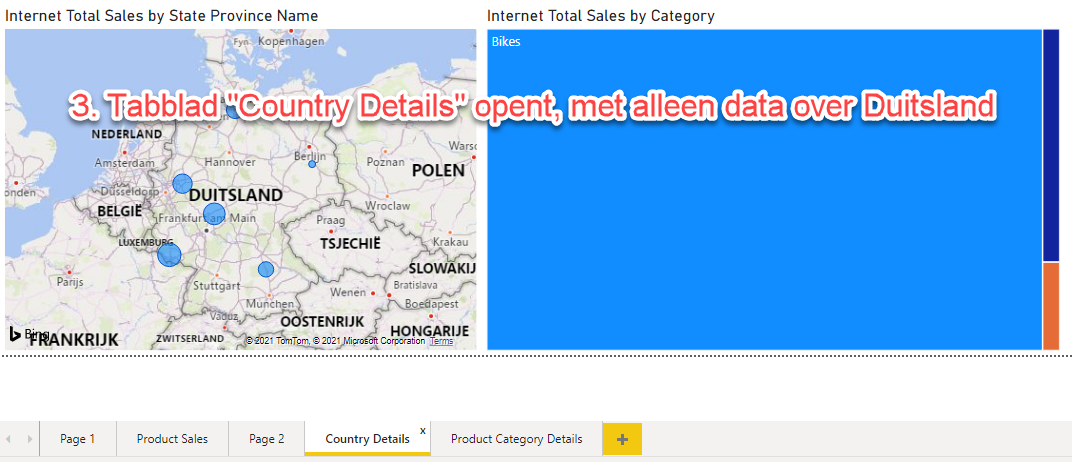
Drillthrough within a report
If you want to enable a drillthrough within a report, you must arrange the following:
- There should be a page stating the goal of your drillthrough.
- In the example above: the “Country Details” page
- On this target page you need to set a “drillthrough filter”. In the example above, this is the name of the country: when you come across it somewhere in the report, you can navigate to the drillthrough page in two clicks, which is then automatically filtered by the relevant category.
- In the example above, the drillthrough filter is
Country Region Name.
- In the example above, the drillthrough filter is
Set up drillthrough in your report
- Open the report ‘startpoint-module-4.pbit’
- If necessary, reselect your own AdventureWorks dataset (you also did this in module 3)
- Add a page called “Country Details”
- Add a map visual to this (
 ). Configure it as follows:
- Location: State Province Name (table Geography)
- Size: Internet Total Sales (table Internet Sales)
- Now also add a so-called “Treemap” for Internet Total Sales by Product Category Name:
- Use the Product Category Name field from the Product Category table here
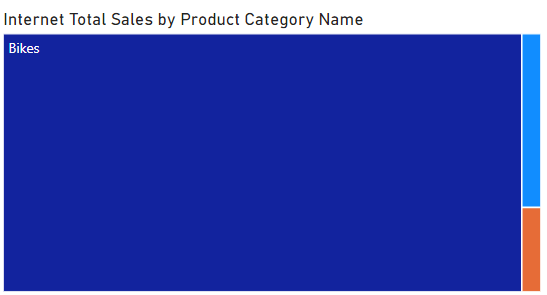
- Use the Product Category Name field from the Product Category table here
- Click anywhere on the canvas so that no more visual is selected.
- Under the heading Drillthrough you will now find a box “Add drillthrough filters here”. Drag the Country Region Name field here (table Geography)
- Go back to the page Page 2, and right click on one of the countries in the chart. You should now have a Drillthrough submenu to the Country Details page
To top it off, you can now hide the Country Details page (right click on the tab, choose Hide Page). People viewing your report won’t be able to see this page directly.
Now try to create a second drillthrough page “Product Category Details” where you list all data within a product category. Filter based on the Product Subcategory Name field (table Product Subcategory). Display the following:
Each point has an extra challenge - you don’t have to complete it. However, if everything comes easily to you and you want to push the boundaries of Power BI a little more, give it a shot!
- Sell per man / woman / married / unmarried
- Extra challenge: add corresponding titles within the visual (“Married men”, “Single men”, etc.)
- Sell by product color
- First additional challenge: display only the 5 best selling colors
- Second extra challenge: let the color be determined by the product color
- Internet Total Sales per year
- Internet Total Units per year
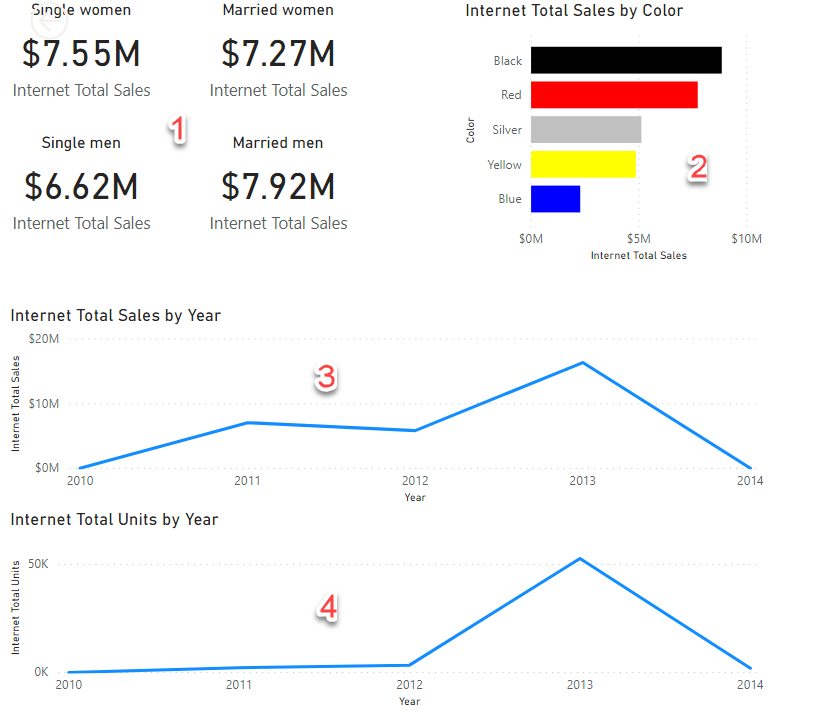
If your drillthrough page is working correctly, you should now be able to drillthrough to “Product Category Details” from page “Product Sales”
Drillthrough between multiple reports
Drillthrough is also possible between multiple reports: you can then give the data more depth from a different angle in another report.
To get Drillthrough between multiple reports working we need (at least) two reports:
- The source report. This is the report you came from (here you “do” a drillthrough)
- The target report. This is the report you end up with after a drillthrough.
Now first create a new report via File, New that connects to the AdventureWorks dataset in your own workspace and save it under the name module-4-drillthrough-report.
In this new report, create a drillthrough filter per Year (table Date, in the hierarchy Calendar). Note that you set here that you should use Year as category:
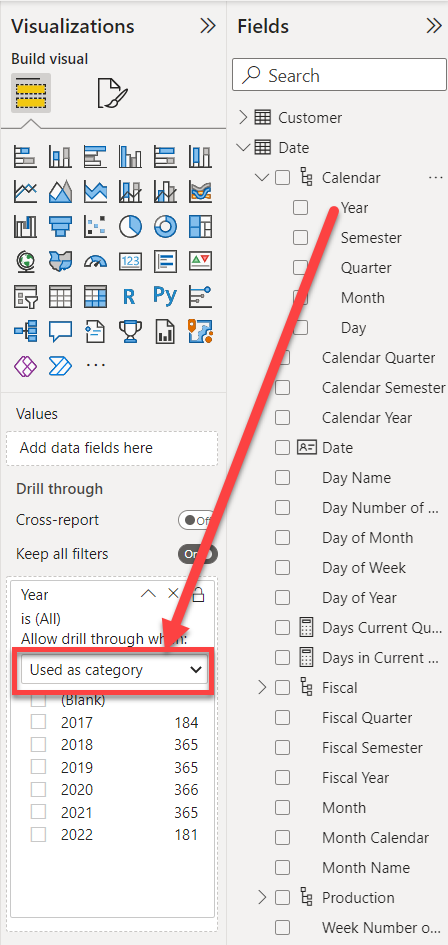
You can then choose a year in the list under this setting that you want to display now (in fact you filter the data on “only the dates of year X”). As soon as you land on this report via a drillthrough, this filter is replaced by the year with which you perform the drillthrough. However, adding this filter will give you a better sense of what the numbers would look like on a drillthrough of (say) 2012.
Then fill the report with insights over a year:
- The course of sales throughout the year (make sure it is sorted correctly)
- The ratio of sales to a quarter ago
Then set up the drillthrough reporting:
- In the source report (where you start the drillthrough action)
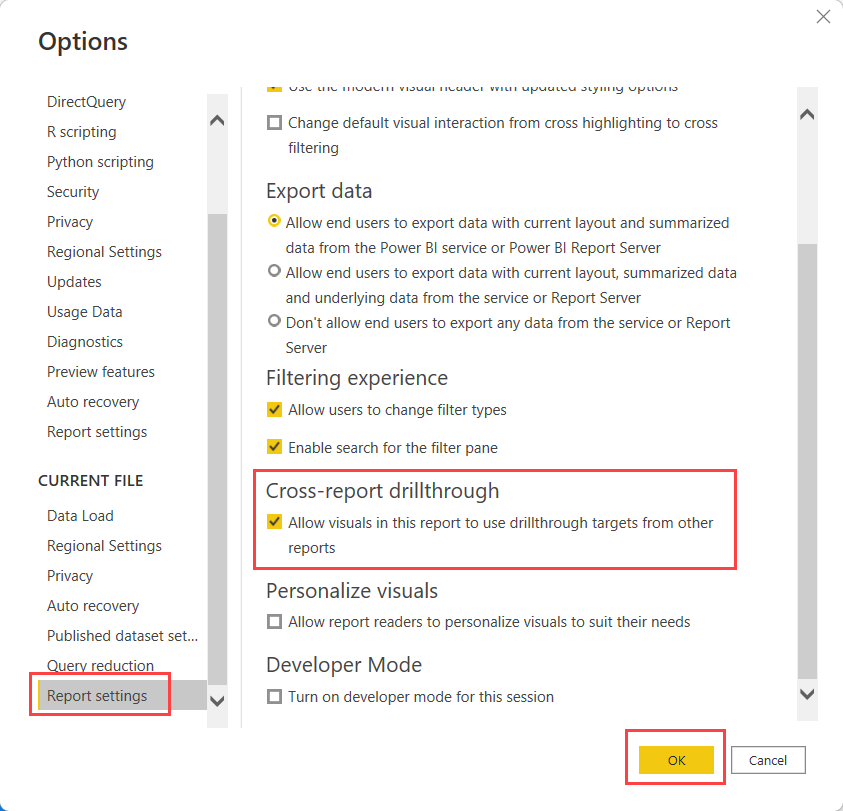
- File -> Options and settings -> Options
- Under Current file, open Report settings
- Check the checkbox at Allow visuals in this report to use drillthrough targets from other reports
- In the doel-rapport (where the drillthrough action will take you):
- Check the box Cross-report under Drillthrough filter
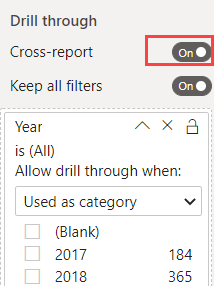
- Check the box Cross-report under Drillthrough filter
Publish the report, and test whether the drillthrough works across reports in the Power BI Portal.
Bonus Exercises
Change the name of the drillthrough action
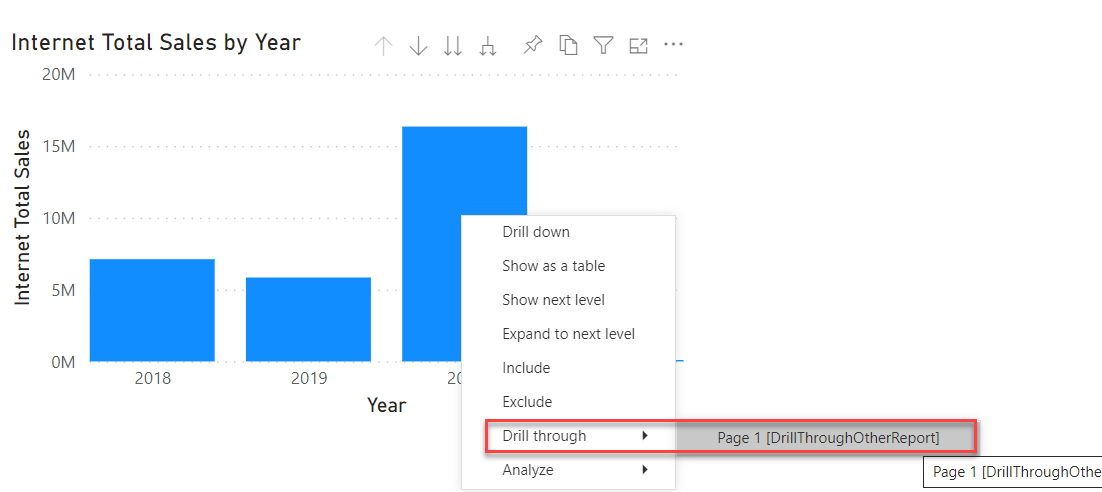
By default, the drillthrough is titled Page1 [name-of-source-report]. Make sure this is replaced by a meaningful name.
Solution
Here’s the endpoint of this lab: 04-01-Solution.pbit en 04-02-Solution.pbit
Video
Here is a Walkthrough video
Next modules
The next module is Module 5: Self-service reporting. We start with Loading CSV files. Below is a complete overview of all available modules:
- Introduction Power BI Desktop
- Reporting on a Dataset
- Visuals and interaction
- Drillthrough (current module)
- Self-service reporting
- Data Modeling 101
- Introduction to Power Query (GUI)
- Publishing and Collaboration in Workspaces
- Calculated Columns in DAX