powerbi-training-en
09 Calculated Columns in DAX
With calculated columns you can have a calculation performed in a column for each row of a table. We saw an example of this in the previous module, where in each row in the product table the corresponding subcategory and category was looked up via the RELATED function.
In this module we look at other possibilities of calculated columns.
Preparation
Let’s continue with the report we built on a CSV file.
Alternatively if you didn’t complete the previous assignment correctly:
Open 06-02-Solution
Calculations
When defining calculated columns you can use a whole arsenal of DAX functions. From very advanced (which actually run a new query for every row in the table) to basic functions such as addition and subtraction.
Below are a few commands - see how far you can solve them with a calculated column:
- In the table “Sales” we want a new column with subtotal including taxes
- In the table “Product” we want a new column with an indicator if a product is red in color
- In the “Product” table we want a grouping of listprice.
- Column name: “price_segment_code”
- listprice = 0 -> Blank
- listprice between 0 and 1000 -> 1
- listprice between 1000 and 2000 -> 2
- listprice between 2000 and 3000 -> 3
- listprice between 3000 and 4000 -> 4
- Try to get the display to show as an integer in the data model
- In the table “Product” we also want to label the price segment
- Column name: “price segment”
- 0: “No money”
- 1: “Cheap”
- 2: “Less Cheap”
- 3: “Duration”
- 4: “Exorbitant”
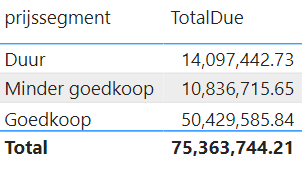
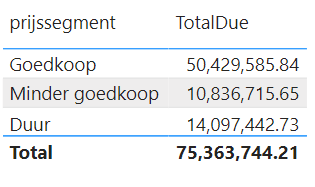
- Now when you group the sales by price segment in a visualization, you will see that it is sorted alphabetically:

- Make sure this sort is based on the price_segment_code. No need to use or modify DAX expressions here!
- Then hide the column “price_segment_code”

Visual adjustments
After adjusting these definitions and codes, it is time to adjust some things in your report.
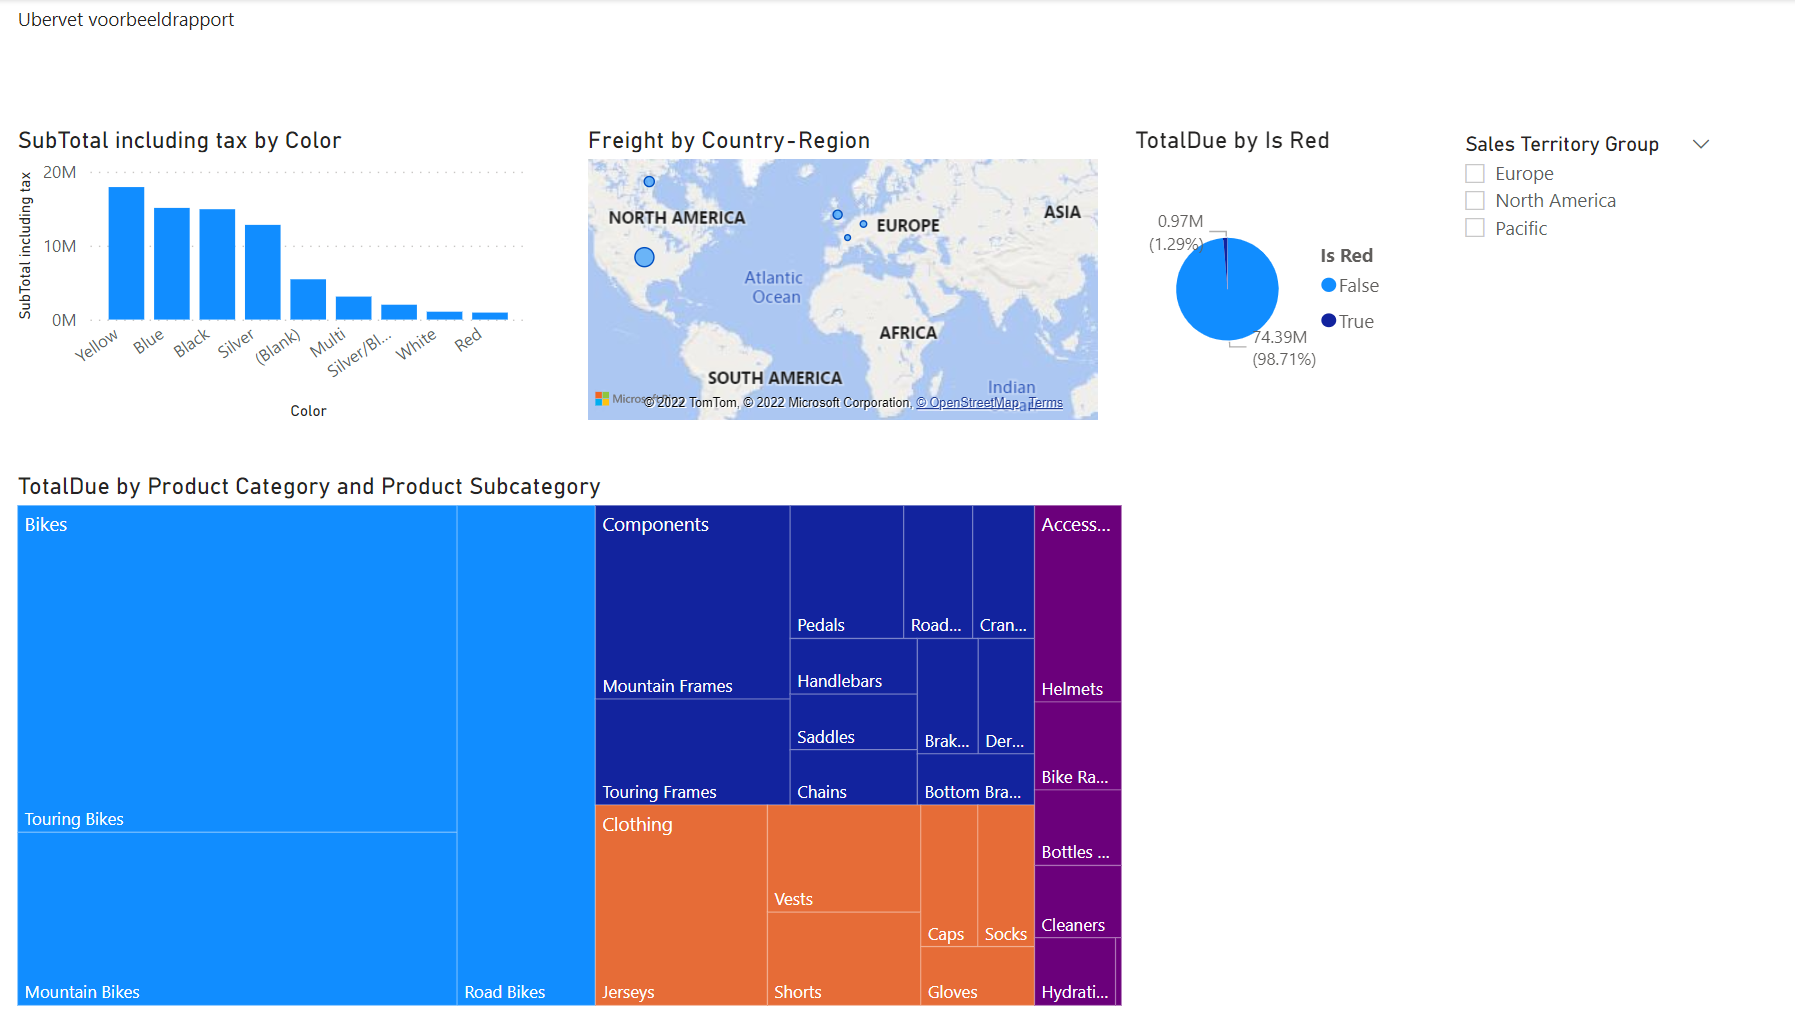
- Go back to the Report view of Power BI, and add a new page here
- Make sure it will look like this.
- Tip: you will also have to make some adjustments to the settings of your data model here …
- … but you don’t need to add extra DAX expressions, measues or calculated columns

Solution
Here’s the endpoint of this lab: 09-Solution
Video
Here is the Walkthrough video
Last module
This was the last module in this course. Want more? Wortell Smart Learning also offers various in-depth training courses in the field of Power BI. For more information, visit https://www.wortellsmartlearning.nl/.
Below is a complete overview of all available modules:
- Introduction Power BI Desktop
- Reporting on a Dataset
- Visuals and interaction
- Drillthrough
- Self-service reporting
- Data Modeling 101
- Introduction to Power Query (GUI)
- Publishing and Collaboration in Workspaces
- Calculated Columns in DAX (current module)