powerbi-training-en
05-01 Self Service Reporting part 1: Loading CSV data
A lot of data is present within the AdventureWorks Data Warehouse, but not all data. It turns out that for specific historical sales figures from 2014 there is still extra data from an old system that is not present in the Data Warehouse. The management department has now made CSV exports of this, in the hope that you can make these transparent in a report.
In this module we load CSV data. There is little knowledge about data types in a CSV file, for example. But the way in which data is stored in a CSV file can also differ. That is why you can sometimes run into challenges here. That is why we are already looking a little bit at Power Query to tackle these challenges. Finally, we make a first visualization on this new data.
Preparation
Start Power BI Desktop with a new, empty report.
CSV-Data inladen
- To load a CSV-file select Get Data -> Text/CSV
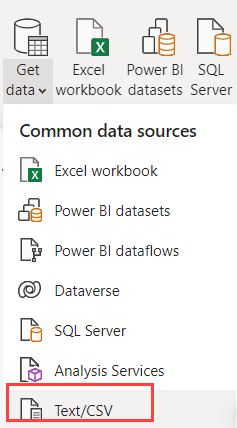
- Selecteer the file “2014-01.csv” from the “csv” folder.
Power BI now estimates the structure of the CSV file. However, CSV is not the most obvious data type. For example, when we look in the CSV file, on line 1 we see the number 26324.3267
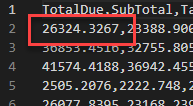
What does 26324.3267 mean?
- Is it 263 million (263,243,267)?
- Is it 26 thousand (26.324,3267)?
Power BI makes an assumption based on the Windows locale settings: in a Belgian or Dutch Windows installation it will make the assumption that a dot is a thousands separator, and a comma is the decimal separator. But this CSV file comes from an English software package, so that is not correct:

- Click on Transform Data at the bottom of the window to adjust this.
The Power Query window will now open.
On the right-hand side, under Applied steps, you can see the steps Power BI has taken to process your CSV file.
- Under the applied steps, click on the different steps, from top to bottom.
- View what changes happened when loading the CSV.
- What’s going wrong?
- Remove the Changed Type step by clicking the cross next to it.
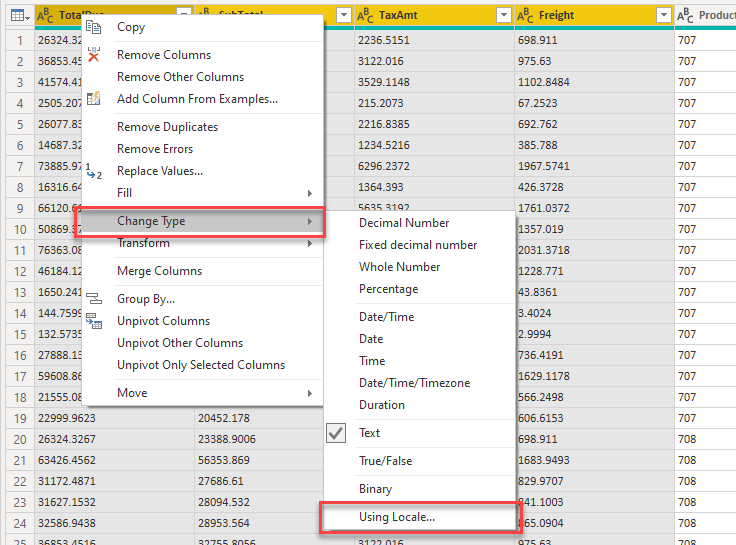
By removing the Changed Type step we have discarded the information about datatypes. Power BI no longer knows what a number or a date is and classifies everything as text. You can also see this by the ABC icon above your columns:

- Now select the first four columns: TotalDue, SubTotal, TaxAmt and Freight
- You can select multiple columns by holding down the Ctrl key on your keyboard
As you saw earlier, Power BI interpreted the numbers (incorrectly) by using the country and region settings from Windows. In English, these settings are called Locale. We are therefore going to tell Power BI again how to interpret this data, but now with the correct region settings / Locale.
- Right click on one of the columns and choose Change Type -> Using Locale…
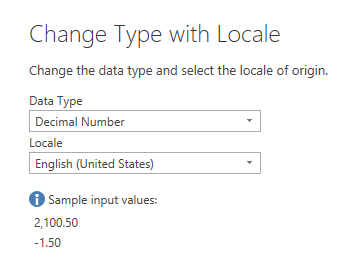
- Select:
- Data Type: Decimal Number
- Locale: English (United States)
Under Sample input values: Power BI displays how the data is expected to be formatted:
- Select all other columns:
- ProductID
- StoreID
- TerritoryID
- OrderDate
- On the ribbon, under Transform, select Detect Data Type

Power BI now recognizes what kind of data is in it based on the content of the other columns.
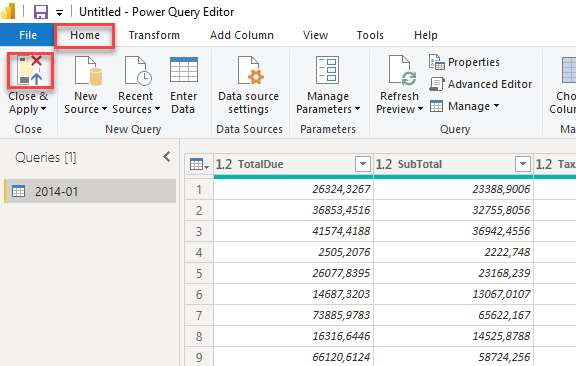
- Select Close & Apply on the ribbon under Home to load the CSV data.
Explore dates
On the right side you will now see a table “2014-01”, with some fields below it. At the moment there is not a lot of useful information in the data model: data from one period from 2014 is available, but all references to shops, products and sales areas are only technical keys (the columns that an underwater database uses to uniquely identify rows). - in this case e.g. TerritoryID and ProductID).
Now create three Power BI visualizations. Make sure that the “per” fields (per TerritoryID for example) below are not summed, but neatly split! Use the standard bar charts, and make the corresponding changes
- TotalDue per TerritoryID
- Set the title of the chart:
- centered
- red
- font Comic Sans, 24pt (let this be the last time you use Comic Sans in a data visualization)
- For TerritoryID, add a Top 6 filter, based on TotalDue
- Change the X-axis from Continuous to Categorical
- Add a title to the X-axis
- Set the title of the chart:
- TaxAmt per ProductID
- Make the X-axis Categorical, then turn it off
- Set as Data colors a Conditional formatting (hint: click on the dots to Default color)
- Set the minimum color to the lightest shade of gray within the theme colors
- Set the maximum color to the darkest shade of gray (not black) within the theme colors
- Leave the other settings as default
- Click “OK”
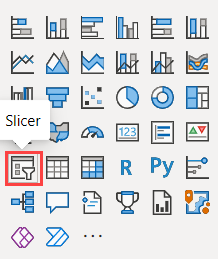
- Add a slicer for the Day field
When you view the file “2014-01.csv” in a text editor (for example in Notepad), you will see that the Day field is not present. Power BI saw here that we had a date field in the source data, and added a hierarchy (Year, Quarter, Month, Day) to this for us.
Handy, because we analyse our data often over time, but we rarely need the date level directly!
Below you can see a possible outcome.

Save the file - we’ll continue with this in the next section.
Solution
Here’s the endpoint of this lab: 05-01-Solution
Video
Here is a Walkthrough video
Next modules
Within this area about Self-service reporting, the next module is Loading data from SQL Databases. Below is a complete overview of all available modules:
- Introduction Power BI Desktop
- Reporting on a Dataset
- Visuals and interaction
- Drillthrough
- Self-service reporting
- Loading CSV files (current module)
- Loading data from SQL Databases
- Data Modeling 101
- Introduction to Power Query (GUI)
- Publishing and Collaboration in Workspaces
- Calculated Columns in DAX