powerbi-training-en
06-01 Relationships
In the previous module we saw that a relationship was missing between the table Store (in which the stores are located) and the table 2014-01 (in which the sales from 2014 are supplied).
Preparation
Let’s continue with the report we built on a CSV file.
Alternatively if you didn’t complete the previous assignment correctly:
Open 05-02-Solution
Creating Relationships
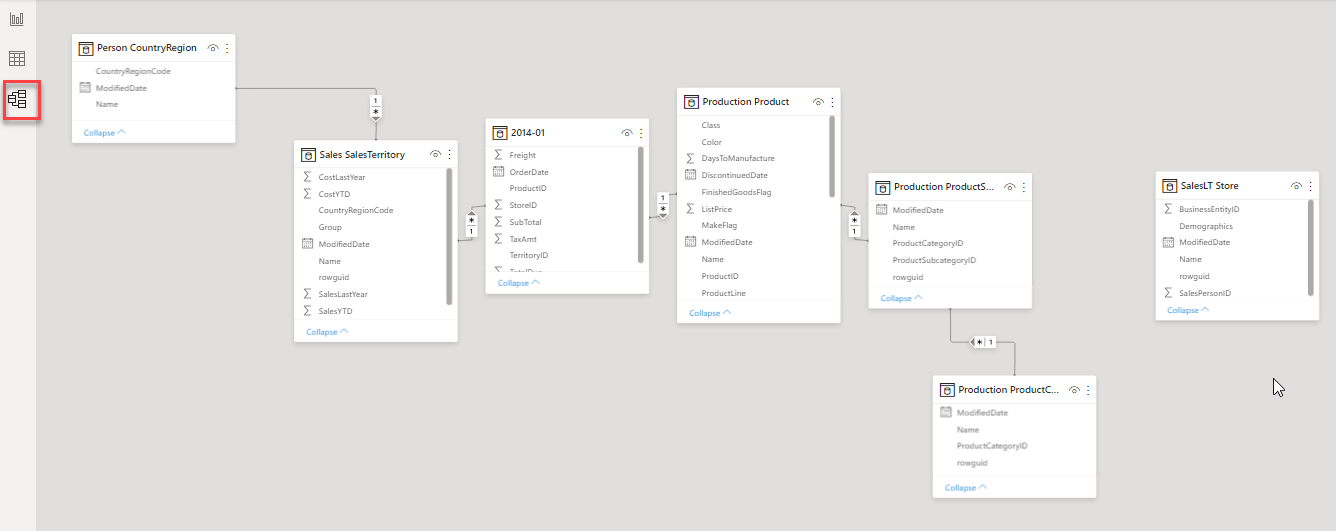
To create relationships, switch to the “Model” view.

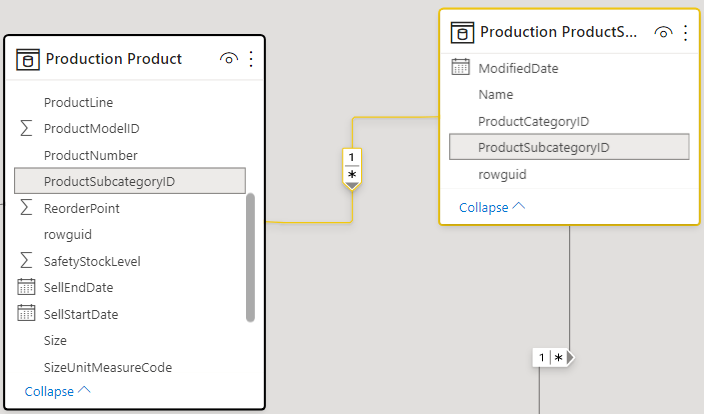
As you can see, there are several relationships, represented by lines between the tables. When you click on a relation, you can see how the relation runs and which columns refer to each other. There are three important characteristics in a relationship:
- the “1” side
- the “*” side (this is called the “many” side)
- the filter direction

In the picture above:
- The relationship is between Production ProductSubcategory and Production Product
- The relationship is on both sides on the ProductSubcategoryID column
- The ProductSubcategoryID column is unique within the Production Product table (indicated by the “1” in the relationship)
- When you filter the Production ProductSubcategory table (for example, by clicking on a subcategory in a report), this filter continues to work in the list of displayed products.
Try the filtering in the Report view of Power BI. Does it work as expected?
A relationship is currently missing between the “2014-01” table and the “Store” table. Create this by dragging the column “BusinessEntityID” from “Store” and dropping it above the column “StoreID” in the table “2014-01”:

Now return to the “report” view and verify that the display of freight charges per store is correct.
Solution
Here’s the endpoint of this lab: 06-01-Solution
Video
Here is the Walkthrough video
Next modules
The next module is Module 7: Introduction to Power Query (GUI). Below is a complete overview of all available modules:
- Introduction Power BI Desktop
- Reporting on a Dataset
- Visuals and interaction
- Drillthrough
- Self-service reporting
- Data Modeling 101
- Relations (current module)
- Cleaning up your Data Model
- Introduction to Power Query (GUI)
- Publishing and Collaboration in Workspaces
- Calculated Columns in DAX